2025: A Year of Resilience or Reckoning?
Despite ongoing challenges, financial markets demonstrated remarkable resilience in 2024. Concerns about a potential "hard landing" recession, political uncertainty, and corporate profitability have proven unfounded in light of strong global economic growth. Corporate earnings exceeded expectations, fueled by advancements in AI, government support, and decreasing inflation.
While the current economic strength is encouraging, we have concerns as we approach 2025 for two reasons. First, U.S. market valuations are stretched, based on several valuation metrics. Second, if not addressed, rising budget deficits and interest rates could further strain the economy, stoke inflation and potentially trigger a debt crisis.
Current levels for U.S. equites coincide with previous market tops. As a firm, we do not believe in market timing, yet it’s important to recognize the risks and position accordingly. We continue to diversify portfolios, allocating to international markets which have more favorable valuations, while maintaining a slight tilt to U.S. value stocks to reduce tech concentration. In addition, we continue to limit interest rate risk, given fiscal and monetary uncertainties. We favor gold as a hedge and portfolio diversifier, which has been the best performing asset class over the trailing 3-year period. Should we encounter market volatility in 2025, we believe we’re well positioned and as always will monitor markets and look for ways to adjust portfolios.
Macro Outlook: Growth at a high cost
Global GDP Growth Forecasts
OECD Real GDP Growth, Actuals and Forecasts
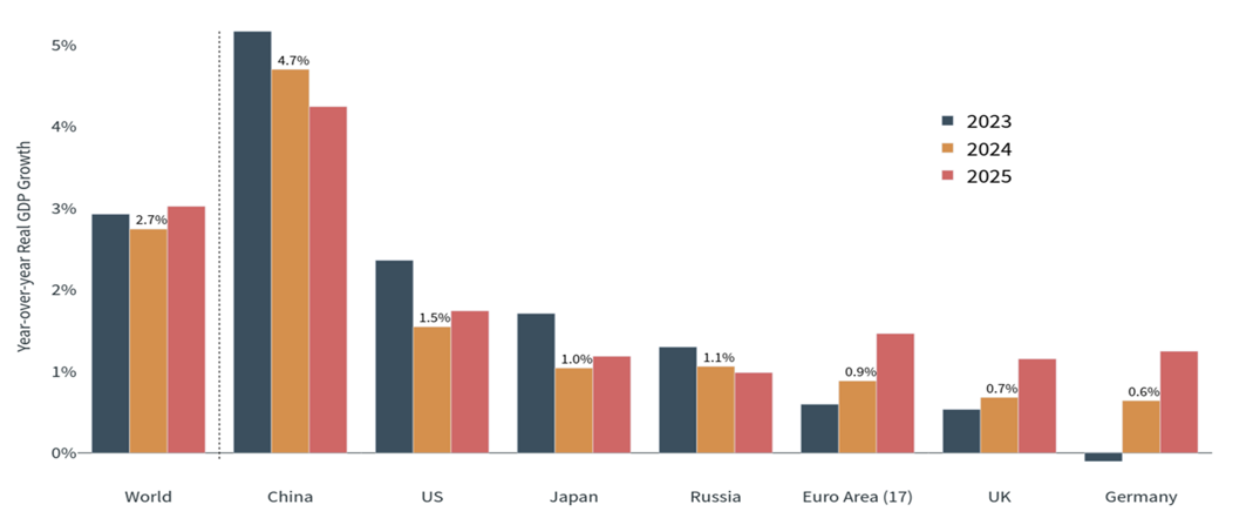
Source: Clearnomics, OECD
© 2024 Clearnomics, Inc.
The Organization for Economic Co-operation and Development (OECD) forecasts global growth to reach 3% in 2025, driven by an improving outlook for the U.S. and the EU. While this outlook is promising, it comes with significant challenges. With interest rates significantly above their all-time lows, the financial burden of the U.S. national debt has escalated rapidly. The explicit cost of servicing this debt, in the form of interest payments, presents a large and unsustainable problem. Since March 2022, the interest expense on the U.S. national debt has more than doubled, rising from $525 billion to over $1.1 trillion. If corrective measures are not implemented, this expense could double again to over $2 trillion by 2030.
Equities: Stretched U.S. valuations could limit further upside
Most investors focus on price-to-earnings (P/E) multiples or perhaps cyclically adjusted price-to-earnings (CAPE) ratios, but one metric that’s often overlooked is the Market Cap/GDP ratio. In a 2001 interview, Warren Buffett referred to this as "probably the best single measure of where valuations stand at any given moment." What does this measure? It takes the total market value of all publicly-traded stocks within a country and divides it by Gross Domestic Product (GDP). By comparing the stock market's size to the overall economic output, this ratio provides a snapshot of the market's valuation in relation to a country's economic performance. This ratio reached a 50-year high in December:
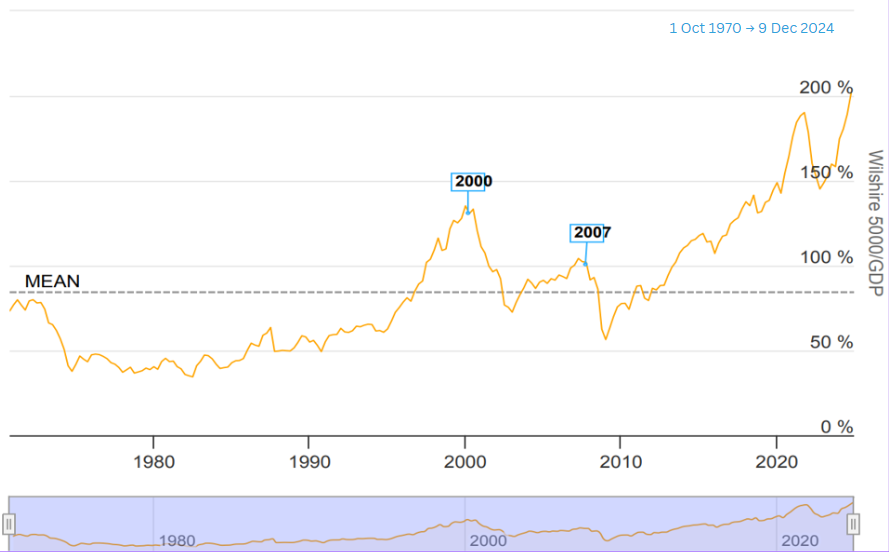
Source: Longtermtrends.net
While this ratio suggests U.S. stock valuations are high, it is by no means a perfect measure. The U.S. economy today is much different from what it was ten years ago—some of the value added by the technology sector and digital economy is not included in GDP. In addition, technology stocks comprise 30% of the U.S. market, with a handful of tech companies responsible for most of the sector's overall valuation. Moreover, this metric does not account for the global nature of many U.S.-based companies, which often generate a significant portion of their revenue from international markets.
Despite these limitations, this metric suggests that investors may be overpaying for anticipated gains in AI and technology. Forward price-to-earnings (P/E) multiples support this view; the expansion of technology stock valuations has widened the gap between U.S. and non-U.S. stocks to levels not seen in a long time.
Global Equity Valuations
Forward P/E Ratios for the S&P 500, MSCI EAFE and MSCI EM since 1995
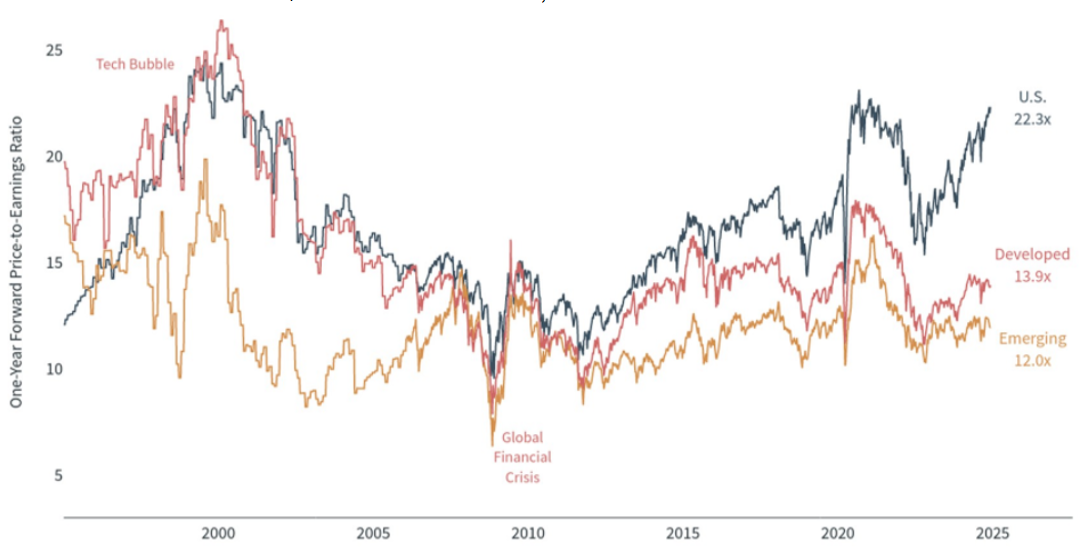
Latest data point is Dec 3, 2024
Sources: Clearnomics, Standard & Poor’s, MSCI, LSEG
© 2024 Clearnomics, Inc.
As shown in the graph above, the current forward-looking P/E ratios for developed and emerging market non-US stocks have remained relatively stable compared to their levels in 2011. In contrast, the forward P/E ratio for U.S. stocks, as represented by the S&P 500 Index, has increased by 60% over the past 13 years. At over 22 times forward earnings, the current ratio is slightly below its historical peak of 24.5 during the dot-com bubble from 1995 to 2001—a period characterized by excessive speculation fueled by a surge of interest in internet companies. Some analysts argue that the current AI boom resembles the dot-com era and may lead to a market crash. However, others disagree, pointing to significant differences between the tech sector today and during the dot-com era.
Regardless of which perspective is correct, the current high valuations of tech stocks underscore the potential risks investors face when heavily concentrated in this sector. As technology's share of the U.S. market has increased, it has taken on a larger and more crucial role in driving overall market performance. For instance, in 2022, when the U.S. market declined by approximately 20%, several large-cap tech stocks saw 30-50% losses, highlighting the importance of diversification of investment portfolios.
Finally, comparing equity market valuations to bonds paints a similar picture. Since 2001, the earnings yield on the S&P (which is the inverse of the PE ratio) has exceeded that of a 10-year treasury bond. This has historically been the case, as equity investors expect a higher rate of return for the additional risk of owning a riskier asset class. With the rally in 2024, a 10-year treasury now has a higher yield than the S&P yield for the first time in over 20 years:
Bonds look cheap relative to stocks, driven by rising Treasury rates coupled with lower equity earnings yield.
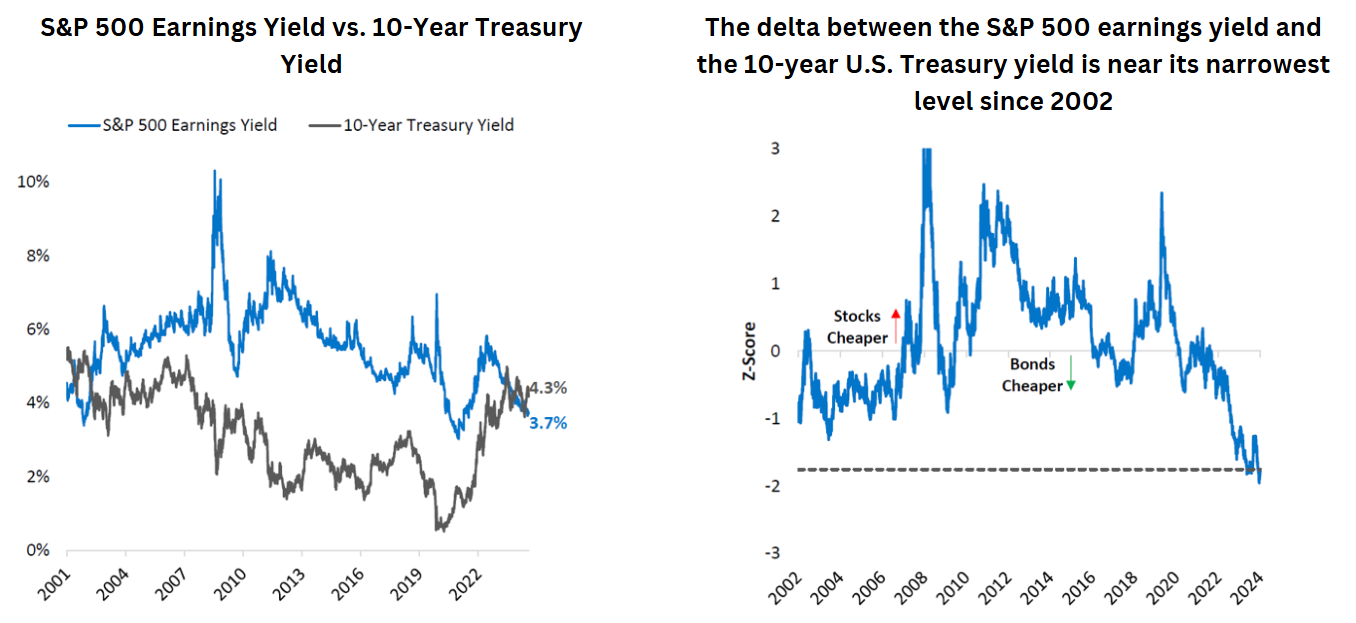
Sources: DoubleLine, Bloomberg
Z-scores measure the number of standard deviations above or below the mean of the sample. Dashed lines represent the Z-score as of October 31, 2024.
You cannot invest directly in an index.
While it’s impossible to predict future market returns, we do know that higher valuations have historically led to lower future equity returns. Earnings will need to increase at a double-digit rate for the next several years to grow into the current market prices, which is possible but could ultimately prove to be overly optimistic.
Fixed Income: Annual deficits compound the debt problem
For decades, we’ve heard that “deficits don’t matter.” Deficits tend to increase during recessions as the government pays more benefits and slower economic activity results in less tax collection. During expansions, deficits tend to decrease, and higher tax collection is expected to put the budget back on a stable path. Since 2009, despite seeing steady growth, deficits have ballooned from $13 trillion to $36 trillion, now reaching 120% of GDP and expected to increase further:
Federal Debt to GDP
U.S. federal debt as a percentage of GDP, gross and net
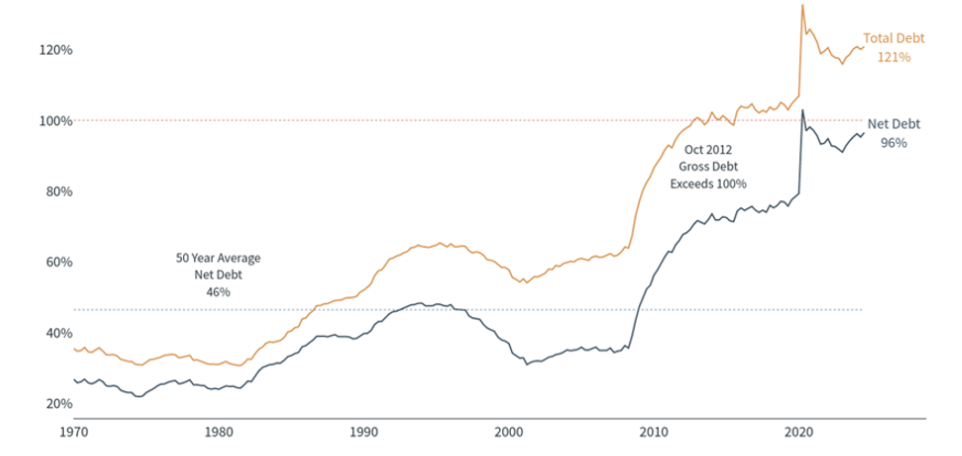
Latest data point is Jul 2024
Sources: Clearnomics, U.S. OMB
© 2024 Clearnomics, Inc.
While this in itself is not an issue, the higher debt burden does increase the risk to bond holders, which could create a vicious cycle where bond holders demand higher rates for holding bonds, causing higher budget deficits for the government. This is where we are now, and why we remain neutral on adding more interest rate exposure to fixed income portfolios.

fred.stlouisfed.org
Sources: Treasury, BEA
© 2004-2024 Towneley Capital Management, Inc. All rights reserved. Any use, including reproduction, modification, distribution, or republication, without the prior written consent of Towneley Capital Management, is strictly prohibited.
The hope is that the economy grows at a pace that will decrease the share of national debt as a percentage of GDP. Any number over 100% suggests excessive debt, and at 120% the U.S. is only behind Japan as the most heavily indebted nation in the world. While the world views the U.S. as a safe haven, this could change should inflation remain elevated, or trust is lost in the U.S. dollar.
The new administration has created a Department of Government Efficiency (DOGE) to investigate ways of reducing our deficits. This is encouraging, but decreasing or changing entitlement programs will be necessary to meaningfully change the current trajectory of our deficits. This is highly unlikely to occur, which means any potential changes made with DOGE will be marginal at not enough to really move the needle.
Commodities: Gold continues to perform well in a tough environment
Towneley has long recommended a small (5%) allocation to gold in client portfolios. Gold has shown significant diversification benefits over several market cycles. Recently, the price of gold has increased at a rate exceeding the returns of major market indices. Over the past three years, the price of gold rose nearly 14% per year, global equities gained 8% annually, and fixed income remained flat. We believe that with global uncertainty, rising budget deficits, sticky inflation and weakening currencies, gold will continue to play a valuable role in portfolios.
Conclusion
Global equity markets have enjoyed extraordinary returns over the past decade, while fixed income has lagged. However, given current stock market valuations and the normalization of interest rates, we expect fixed income to play a larger role in total returns over the next several years. Towneley remains committed to building durable portfolios that are positioned to benefit in up markets, but also potentially providing favorable downside protection.
Download the Article Here