Strength in Tech Overshadows Macro Headwinds
On the back of a robust labor market and declining inflation, global markets experienced a strong first half to the year, with the Russell 3000 increasing 16.2%, MSCI ACWI-EX US up 9.5% and Bloomberg Aggregate Bond Index up 2.1%. The story for the year has been the resurgence of technology stocks following a challenging 2022, with the “Magnificent Seven” leading the market higher and accounting for roughly ¾ of the gains YTD.
Despite weakness in corporate earnings, investors appear to be looking forward and expecting a better earnings picture beginning in 2024. According to FactSet, 2Q earnings are expected to decline -7.2% compared to 2Q22, marking three consecutive quarters of negative y/y growth. Historically, earnings and stock prices have increased in tandem, so investors are paying more for earnings on expectations that recent weakness is temporary.
While recent economic data (particularly labor) has been positive, higher input costs, continued onshoring and recent dollar weakness suggests inflation may continue to be problematic for the foreseeable future and requiring the FED to keep short-term rates higher for longer. In addition, low levels of consumer sentiment and high debt levels will make it difficult for corporations to pass on higher costs, as they have been able to do over the past couple of years. This inability to pass through costs, coupled with higher levels of interest rates, challenges the narrative for an improved earnings outlook and which could limit further gains from here.
Given the market's reliance on a handful of names, we continue to maintain our positioning in equities by remaining slightly overweight Value vs. Growth (55/45) in domestic and maintaining the current split between U.S. and Non-U.S. (70/30) in total equities. This positioning allows us to reduce the concentration risk to technology, which currently accounts for 28% of the U.S. equity market and allows us to reduce the valuation multiples at the portfolio level.
On the fixed income side, we continue to look for ways to extend duration (interest rate risk) based on our view that longer-term structural headwinds remain for the economy, which will push longer-term yields lower. In addition, adding duration should increase portfolio resiliency, reduce reinvestment risk, and capture higher long-term rates.
Economic Growth Remains Tepid
During the first quarter, the U.S. economy grew at a solid 2% annual rate, and the FED is forecasting similar gains during the second quarter. Two percent annual GDP is in line with levels seen since 2009, but relatively weak given the level of deficit spending and support that’s been required to achieve this growth. The national deficit stands at nearly $33 trillion, with an estimated $1.5 trillion being added in 2023. In addition, the FED’s balance sheet is close to $9 trillion. This level of deficit and stimulus is unsustainable given the higher level of interest rates, which suggests fiscal and monetary policy may not be a viable solution should the economy encounter a meaningful slowdown.
Headline Inflation Cools While Core Inflation Persists
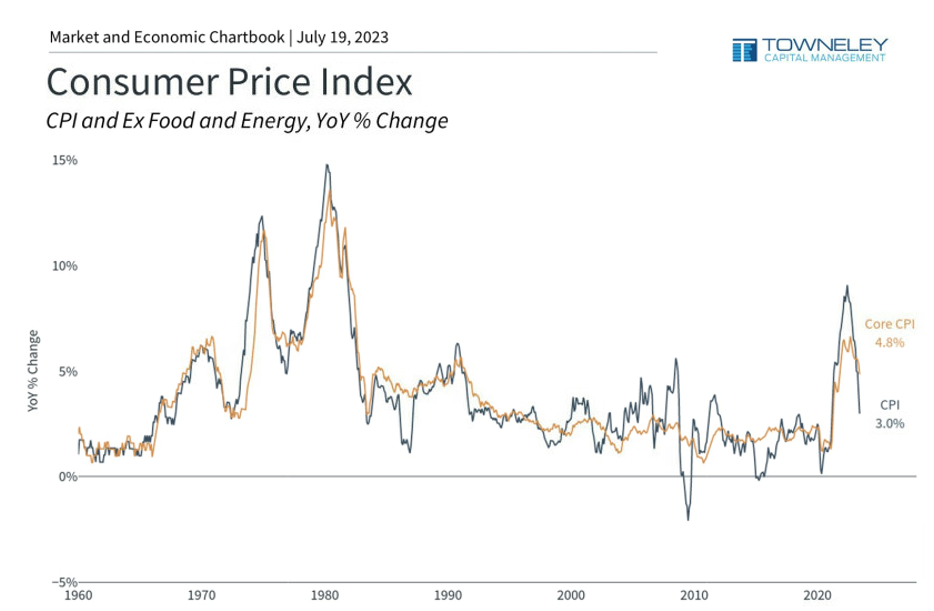
The Bureau of Labor Statistics’ June CPI release reported that CPI-U (which tracks changes in consumer prices for goods and services) slowed to 3.0%, in part because the COVID-era baseline increases fell out of the year-over-year calculation. While the decline in headline inflation is welcome news, core inflation (inflation which excludes food and energy prices) remains stubbornly elevated. Federal Reserve Chairman Powell doesn’t expect this figure to reach the central bank’s 2% target until 2025, which likely means that the Fed Funds rate will remain higher for longer.
Latest data point is Jun 2023
Sources: Clearnomics, Bureau of Labor Statistics
© 2023 Clearnomics, Inc.
CPI is a commonly cited measure of inflation. It uses a basket of goods and services to track price changes for consumers.
In order to measure the underlying trend in inflation, rather than temporary shocks to food and energy, economists often focus on core CPI.
Price increases have been cooling but services inflation remain problematic.
Labor Remains a Bright Spot
U.S. employers added 209,000 workers in June, a sign of slight cooling compared to the May increase of 339,000. The unemployment remains very low at 3.6% with wage growth at 4.7% according to the Economic Policy Institute. The job market remains unexpectedly strong, surprising economists that believed Fed rate hikes would curtail employment and cause a recession. Although several industries, including tech, manufacturing, and retail, have announced layoffs, many business owners are having difficulty attracting and retaining employees, resulting in tight labor markets. Until this pressure eases, getting inflation back to a 2% level will be difficult.
Services PMI Offsetting Manufacturing Weakness
The services sector expanded in June for the sixth consecutive month as the Services PMI® reached 53.9 percent. The Services PMI, which measures activity and expectations for the transports, communication, financial and business services sector, has grown 36 of the last 37 months (contracting only in December of last year). This figure remains above 50, which suggests economic expansion. Manufacturing data, on the other hand, continues to point to a contraction, with the latest ISM data coming in at 46 and marking the 8th consecutive month of declines. Given the large impact of the services sector on the U.S. economy, the strength in services is offsetting weakness in the manufacturing sector.
Money Supply and Credit are Shrinking
Another important variable affecting the economy is the M2 measure of the money supply, which declined by 4.7% between July 2022 and April 2023, according to the St. Louis Federal Reserve Bank[i]. The shrinking supply of circulating dollars due to monetary tightening following massive post-pandemic stimulus, among other factors. This decline, in conjunction with higher rates, could hamper economic growth.
Monthly Increase in the Money Supply and Inflation in the U.S.
Money Supply is measured by M2 and inflation by PCE inflation
Rising interest rates have impacted both the cost and availability of credit. Higher mortgage and other loan rates have kept many consumers from financing purchases. In addition, banks’ ability to extend credit has suffered as savers seeking higher yields move their money from bank savings accounts to money market funds (MMFs). Currently, bank savings accounts are yielding an average of 0.6% compared to the 4-5% investors can earn in MMFs. The money held in savings accounts supports bank lending, while the money in MMFs does not. So as the sources of capital banks need to fund lending decline, loans become more expensive and harder to come by, limiting economic growth.
Debt Woes Continue
Although the debt ceiling crisis is behind us for now, government spending is decidedly heading in the wrong direction. In its May Monthly Budget Review, the Congressional Budget Office projected the budget deficit was $1.2 trillion for the first 8 months of the year, $735 billion more than last year. Spending is up by 11% compared to last year while revenues are down 11%. Higher interest rates have had the largest impact on spending, increasing by 34% compared to last year.
Aggregate household debt rose by $148 billion in the first quarter of 2023, a 0.9% rise from Q4 2022. Balances now stand at $17.05 trillion and have increased by $2.9 trillion since the end of 2019. Household credit card debt is closing in on a record of $1 trillion, up from $750b just two years ago. The average credit card APR is 22.4% as of Q2 2023, a year-over-year increase of 350 basis points and the highest figure since the early 1980s.
Financial Market
Equities Show Resilience, Maintaining Positioning
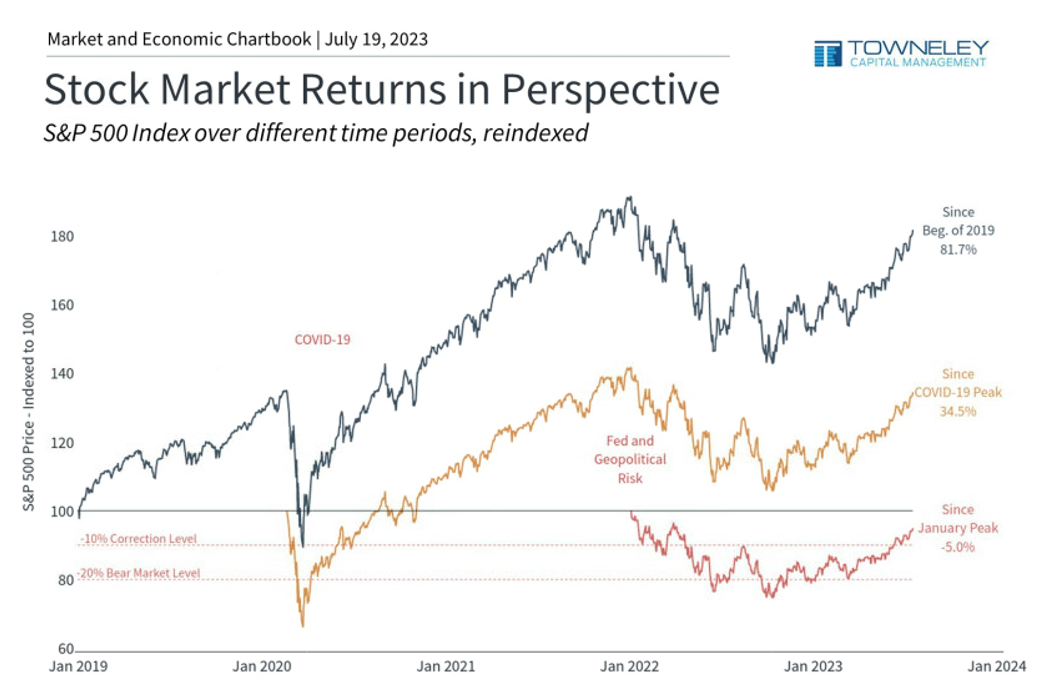
After 2022’s decline of 19.2%, the Russell 3000 increased 16.2% YTD and is now just 5% below its peak from January and up over 81% since the start of 2019.
Latest data point is Jul 18, 2023
Sources: Clearnomics, Standard & Poor’s
© 2023 Clearnomics, Inc.
A key principle of long-term investing is keeping market volatility in perspective.
This means not just focusing on recent performance, but on the broader context and different time frames.
In previous quarterly letters and client meetings, we have discussed the rising concentration risk in passive indexes (particularly the S&P 500) where the “Magnificent Seven” account for 28% of the index. To address this risk, we have shifted some index exposure to actively managed funds and implemented a slight overweight to value strategies (55/45) and we are focusing on high-quality value companies in defensive industries with a history of weathering challenging economic environments.
After months of considering a change to the international equity segment of client portfolios, we have decided to stay put and hold the ratio of U.S./Non-U.S. equities at 70/30. Despite favorable valuations relative to the U.S. markets, we decided that the 28% exposure to technology vs. 8% to the MSCI EAFE Index warrants the premium. We do believe the 30% allocation provides meaningful diversification benefits and lowers the valuation multiple for the overall portfolio, which is why we are comfortable with the current mix.
Factors such as a longer-term decline in the dollar, a deeper U.S. economic recession versus overseas, and a significant downdraft in U. S.’s dominant growth-related sectors, such as technology and communications, would cause us to revisit the international equity allocations.
Fixed Income Bounces Back, Looking to Get More Aggressive
Bonds started the year off strong but cooled recently as the 10-year U.S. Treasury yield rose from 3.4% to 3.8% during the second quarter. Despite this increase, the Bloomberg Aggregate Bond index remains higher by 2.1% YTD.
Following our decision to increase duration (interest rate risk) in March, we continue to look for ways to further increase in client portfolios. We believe doing so will reduce reinvestment risk associated with higher short-term rates and increase portfolio resiliency.
In addition to increasing interest rate risk, we are also looking for credit opportunities in the near future. We’re currently overweight Treasury bonds and underweight corporates, given our belief that investors are not being appropriately compensated for taking on credit risk. We will maintain our current positioning until we see spreads widen and more compelling opportunities.
Commodities Struggle, Gold Shines
The Bloomberg Commodity Index fell 7.8%, reflecting price declines in the energy sectors with crude oil, natural gas, and heating oil all down over 10% in the first half of 2023.
Gold fared much better than other commodities, up 5.4% YTD. The announcement that central banks in Brazil, Russia, India, China, and South Africa intend to create a BRICS gold-backed currency helped drive prices higher. We believe this development, along with the high levels of deficit spending and elevated inflation, will support gold prices over the near-term.
Summary
The Fed’s attempts to rein in inflation appear to be working, at least partially. In June, headline CPI hit a two-year low, boosting stocks and raising hopes that rates hikes are close to ending. While these events are encouraging, we remain concerned about deficit levels and higher interest costs, which could prove problematic in the face of an economic slowdown. In addition, many economic indicators are pointing towards an economic slowdown, including the inverted yield curve and rapid decline in the Leading Economic Indicators (LEI). We also believe the lagged effect of monetary policy has yet to fully show up in the economic data and that banks could experience a second wave of stress related to credit deterioration. Strength in the labor market continues to bolster economic growth, but a reversal here and the risk of no earnings bounce back could limit upside potential from current levels.


